How to Read Candlestick Charts for Beginners
Short answer: candlestick charts show how price moved during a specific time period using the open, high, low, and close of each candle.
Candlestick charts are one of the first things beginners see in trading, and at first they mostly look like angry little rectangles having emotional episodes. Fair. But once you understand the basics, candlesticks become one of the simplest ways to read what price is doing.
In this beginner-friendly guide, you will learn how to read candlestick charts, what candles mean, and what to pay attention to without getting hypnotized by every wick like it contains divine guidance.
What Is a Candlestick Chart?
A candlestick chart is a chart made up of candles that show price movement over a selected time period.
Each candle represents four key pieces of information:
- open
- high
- low
- close
This helps traders quickly see how price moved during that time period.
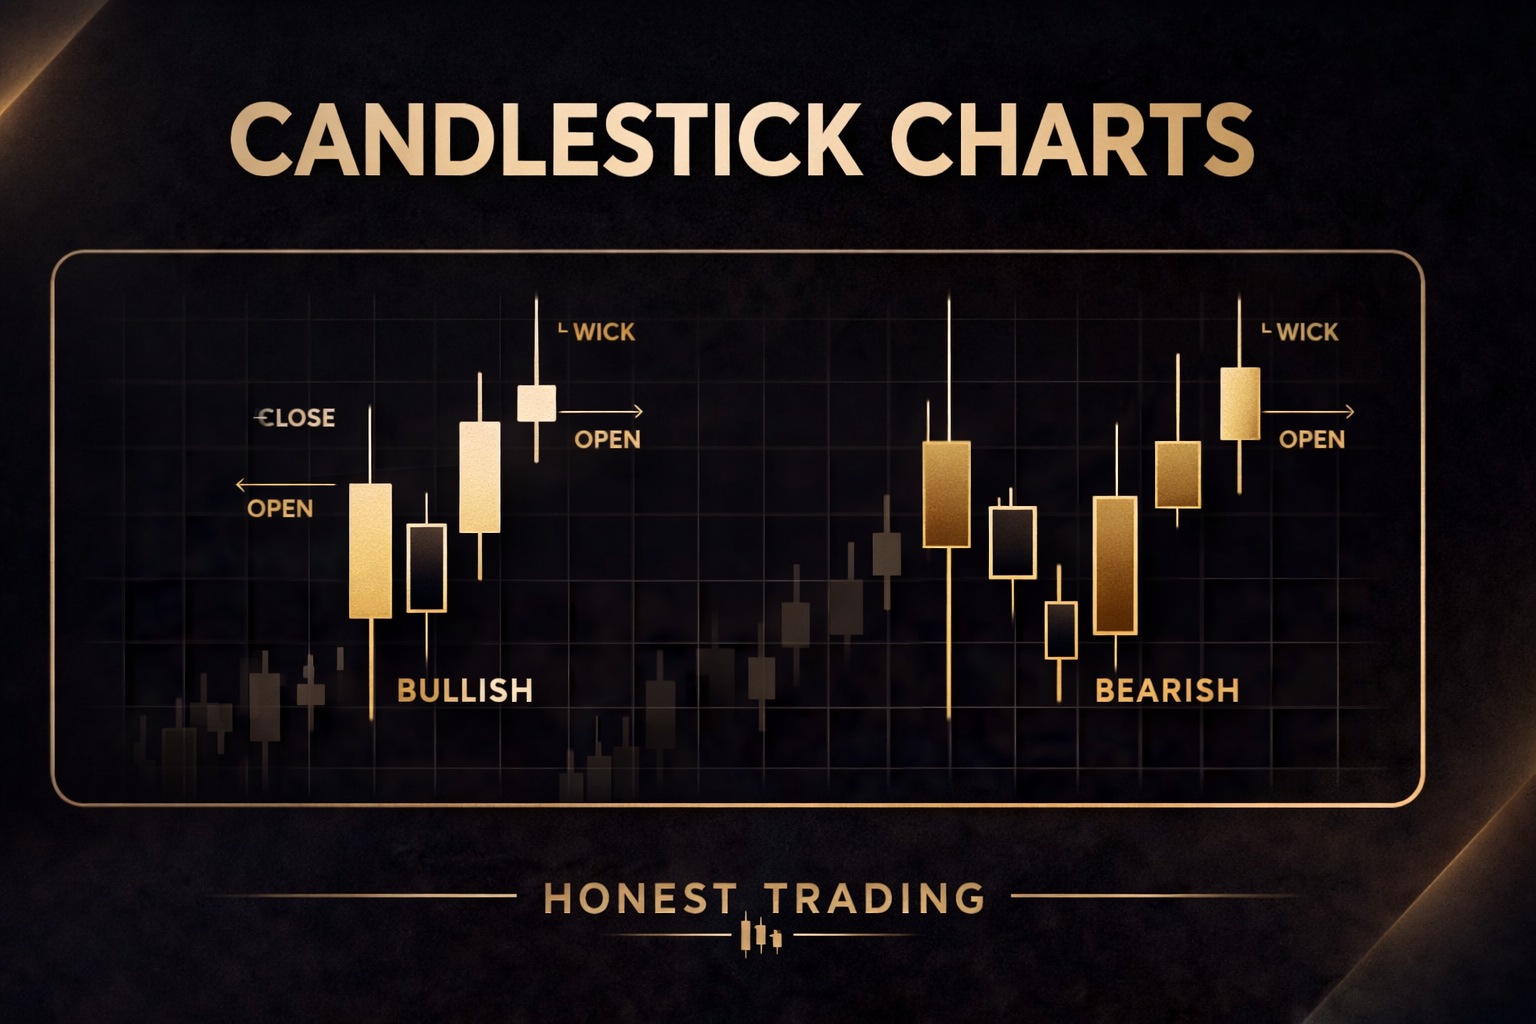
What the Parts of a Candle Mean
Body
The body shows the distance between the open and close.
Wick
The wick, also called the shadow, shows the highest and lowest price reached during that candle.
Bullish Candle
A bullish candle usually means price closed higher than it opened.
Bearish Candle
A bearish candle usually means price closed lower than it opened.
How to Read a Single Candle
A single candle tells you:
- where price started
- where price ended
- how high price went
- how low price went
For example:
- a large bullish candle can show strong buying pressure
- a large bearish candle can show strong selling pressure
- a candle with long wicks can show rejection or indecision
One candle gives you information. A group of candles gives you context. That is where things get more useful.
Why Candlestick Charts Matter
Candlestick charts help traders understand:
- momentum
- rejection
- indecision
- price reaction at key levels
- market structure
They are useful because they show more than just the closing price. They show how price behaved during the entire time period.
Common Candlestick Clues Beginners Should Notice
Large body candles
These often show strong momentum in one direction.
Small body candles
These can show hesitation, balance, or weaker momentum.
Long upper wick
This can suggest price pushed higher and then got rejected.
Long lower wick
This can suggest price pushed lower and then got rejected.
Multiple strong candles in one direction
This can suggest strong momentum or trend continuation.
How Beginners Should Use Candlestick Charts
- look at candles near key support and resistance levels
- use candles to confirm a setup, not create fantasies
- combine candlestick reading with market structure
- pay attention to momentum and rejection
The goal is not to memorize 47 candle patterns with dramatic names. The goal is to understand what price is communicating in a practical way.
Candlesticks Work Better With Context
This is important: candles should not be read in isolation.
A bullish candle at random means less than a bullish candle at support, after a liquidity sweep, in an uptrend, with confirmation.
That is why traders combine candlesticks with:
- market structure
- support and resistance
- trend direction
- risk management
Common Beginner Mistakes
- focusing on single candles with no context
- memorizing patterns without understanding price behavior
- ignoring higher-timeframe direction
- treating every wick like a signal
- entering trades without a clear plan
Not every candle is important. Some of them are just out there existing and minding their business.
Simple Candlestick Reading Checklist
- Is the candle bullish or bearish?
- Is the body large or small?
- Are the wicks showing rejection?
- Where is this candle forming on the chart?
- Does it fit the broader market structure?
- Is it confirming a setup or just being dramatic?
Final Takeaway
If you want to know how to read candlestick charts for beginners, start with the basics: open, high, low, close, body, and wick.
Then focus on how candles behave around key levels and inside the broader market structure.
That is where candlestick charts go from confusing little bricks to useful information.
Want the Simple Version Without the Fake Guru Noise?
If you want beginner-friendly explanations of candlestick charts, market structure, support and resistance, and setup quality, check out the Honest Trading Starter Pack.
Real trading lessons. No hype.
Leave a Reply